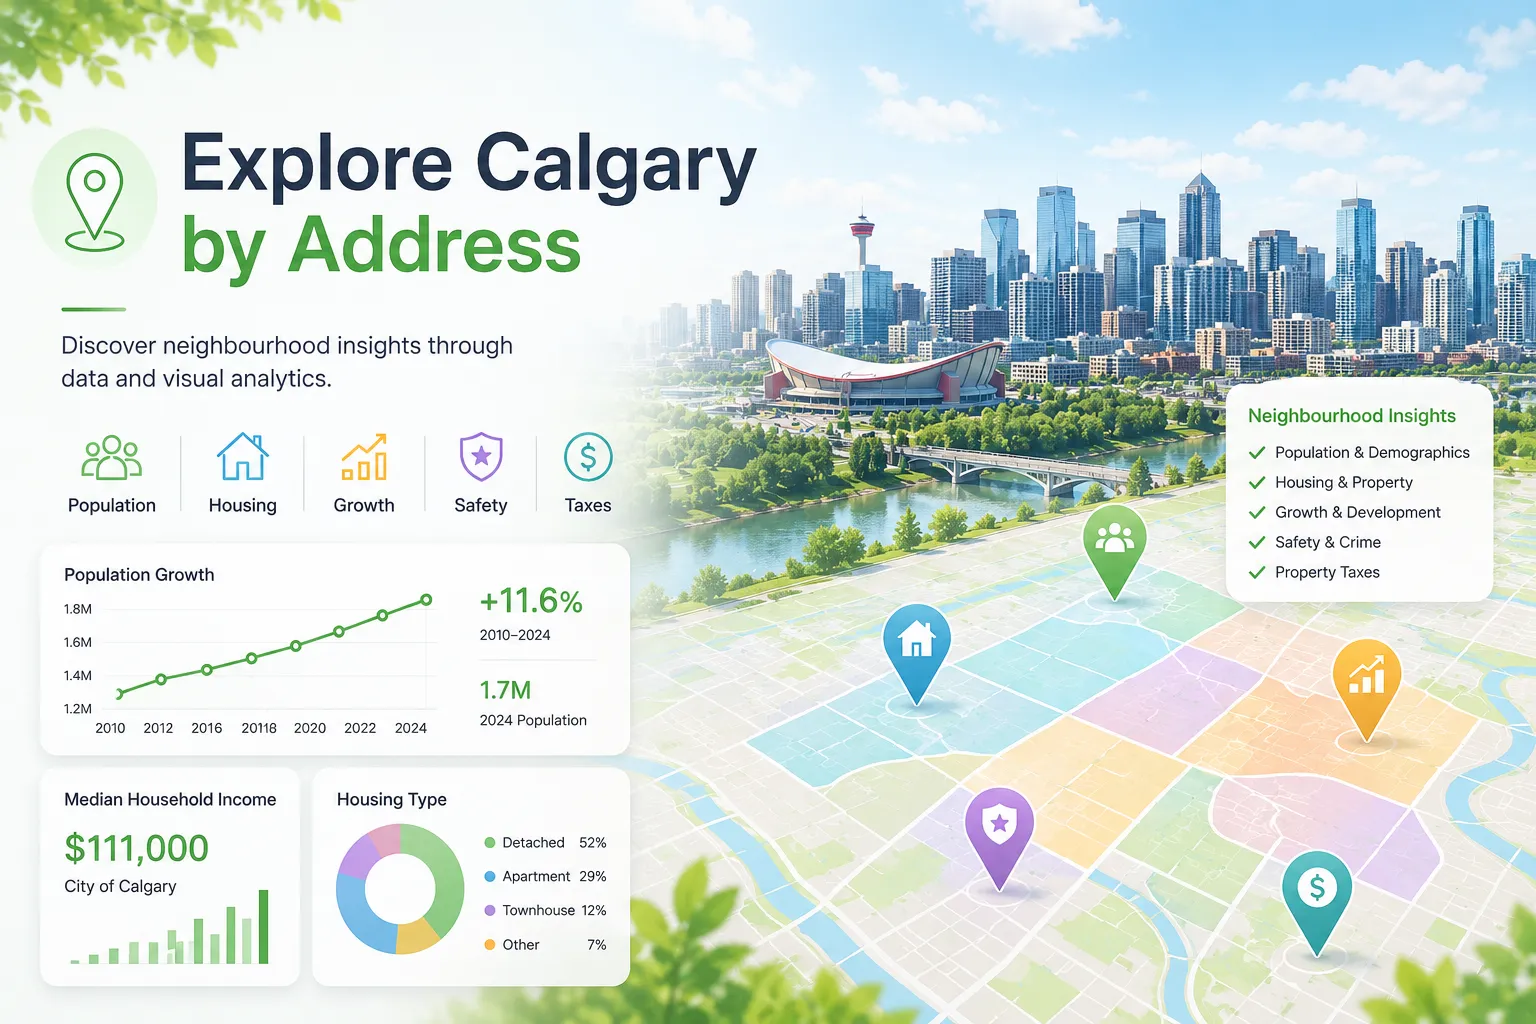
What Can a Calgary Address Tell You?
Explore schools, daily accessibility, property history, crime trends, taxes, and community insights from a single address.
Civic & Social Analytics — Calgary’s schools, students, and labour economy.
Explore Calgary school, community, and demographic data through interactive dashboards covering CBE enrolment, school capacity, baby names, neighbourhood density, community growth, and municipal election turnout.
Explore schools, daily accessibility, property history, crime trends, taxes, and community insights from a single address.
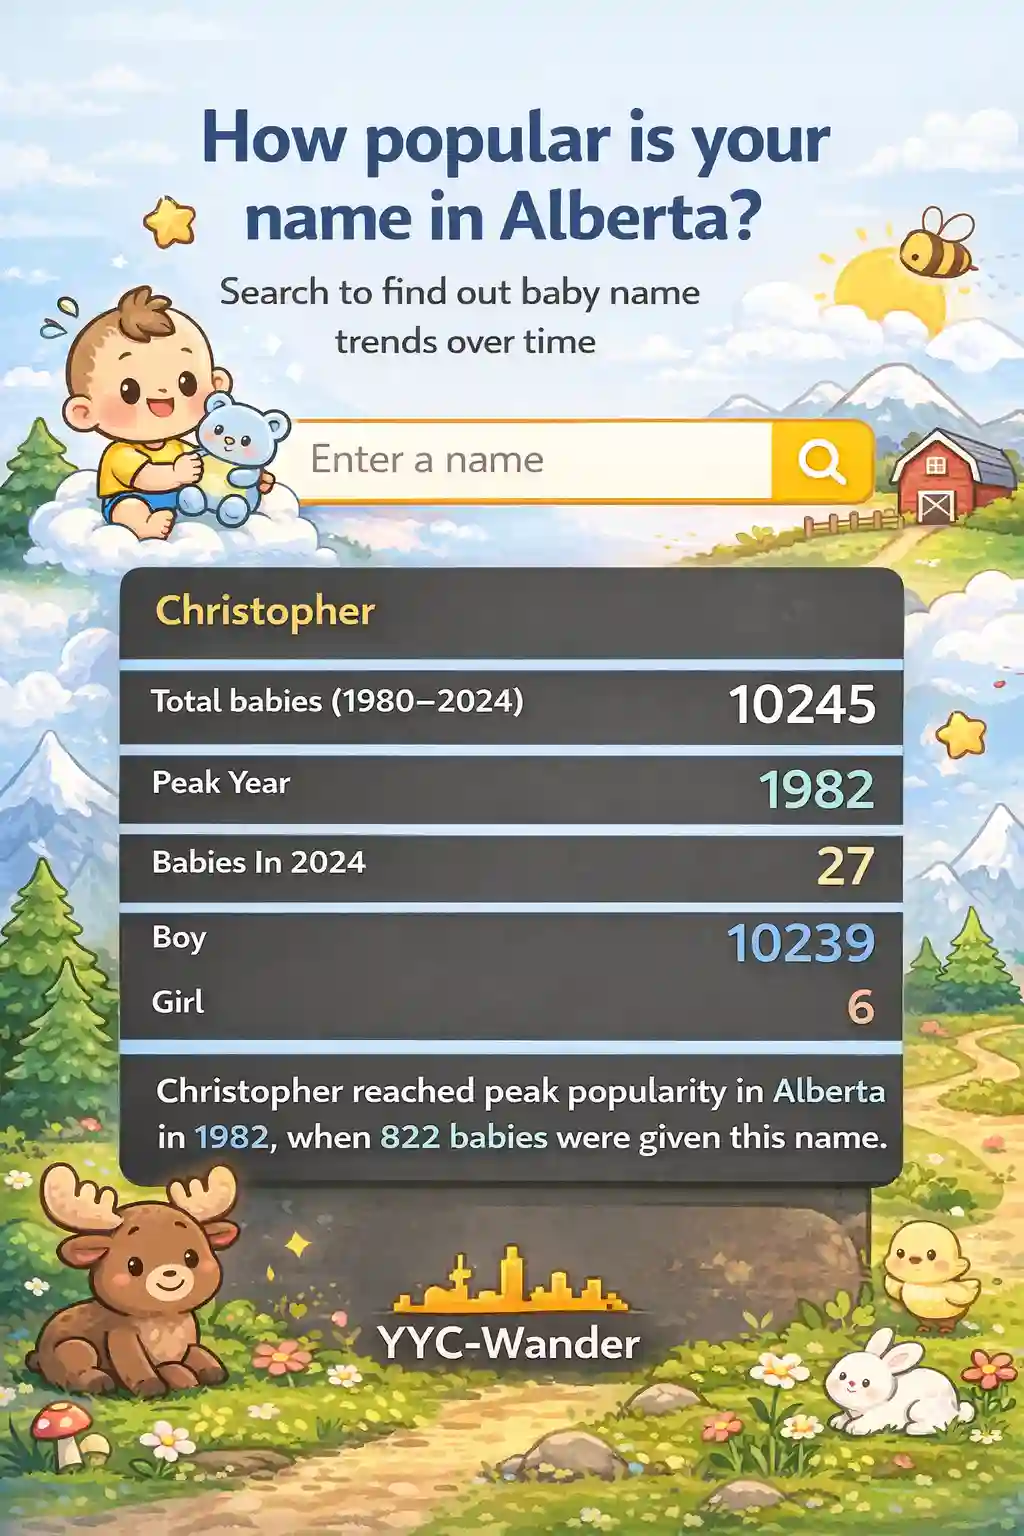
See how your name ranks in Alberta, how it has changed over time, and how common it is today (1980–2025).
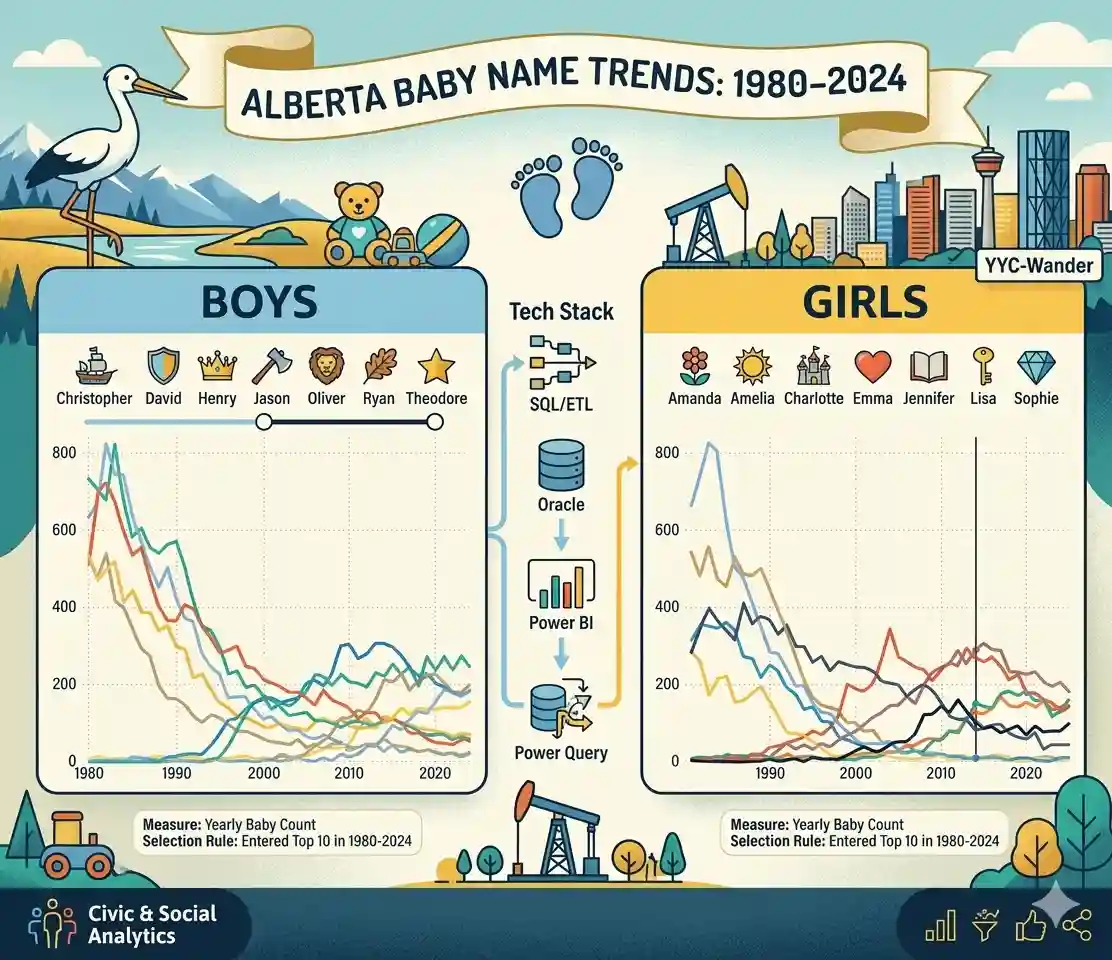
Interactive dashboard of Alberta baby name trends. Compare popular boys’ and girls’ names from 1980 to 2025.

Watch how housing spread across Calgary over time, and see which communities grew earlier, faster, and more densely. (Best viewed on PC or iPad)
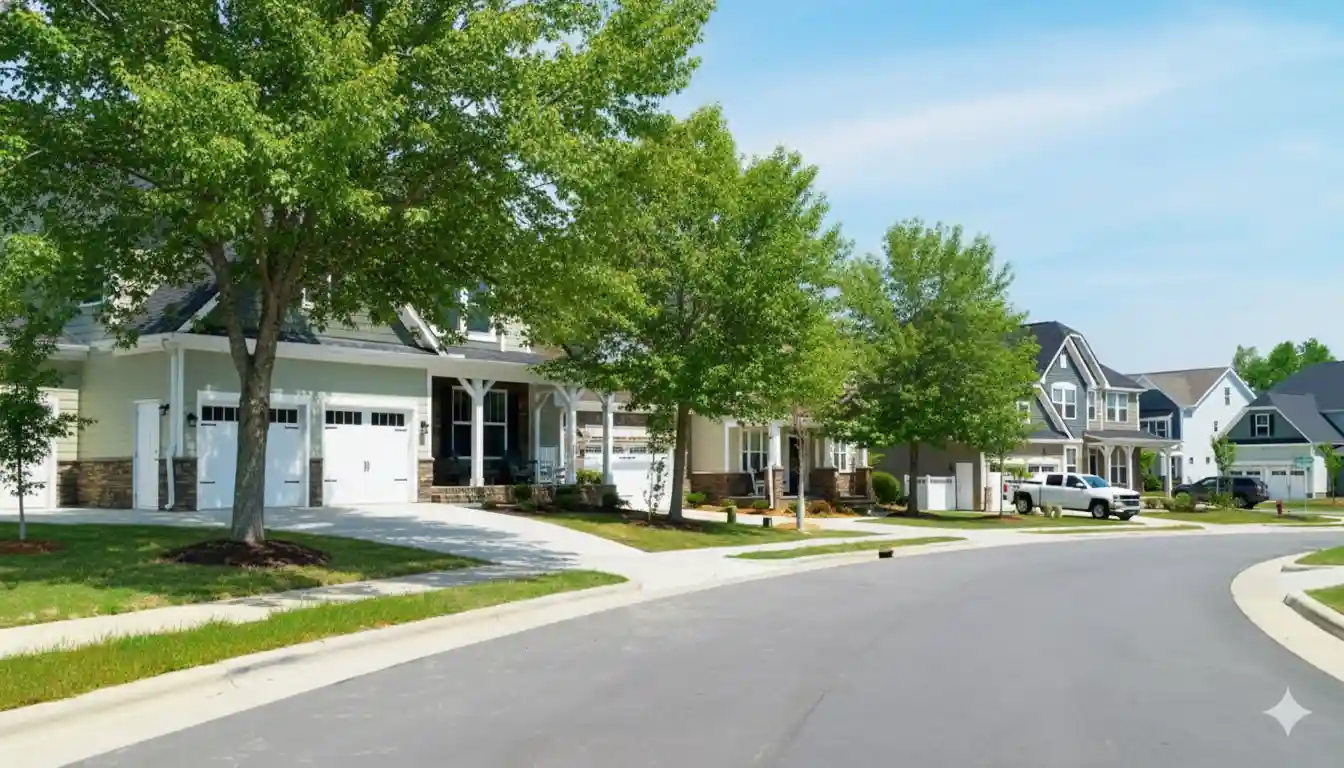
Interactive dashboard of Calgary neighbourhood density. Compare population and housing density across communities and regions.

Interactive dashboard of Calgary public school student counts by level. Explore long-term trends across grades, programs, and total enrolment.

Interactive dashboard of Calgary public school enrolment trends. Compare schools and levels across years, quadrants, and school types.

Interactive dashboard of Calgary public school capacity, enrolment, and utilization trends. Compare schools, spot over-capacity pressure, and identify underused space.
Explore Calgary municipal turnout (1983–2025): electors, votes cast, and turnout rate.
Explore Calgary school performance using Alberta PAT results, including PAT Score, Board Rank, Calgary Public Rank, and multi-year trends.
YYC-Wander Civic & Social Analytics helps residents, parents, students, home buyers, researchers, and community observers explore Calgary civic, school, population, and neighbourhood data through interactive dashboards.
This section brings together Calgary school enrolment, CBE student counts, CBE school capacity, Alberta baby name trends, neighbourhood density, community growth, municipal election turnout, and address-level community insights.
This section includes dashboards related to Calgary schools, students, neighbourhood density, community growth, baby names, municipal turnout, and address-level civic insights.
Yes. The section includes CBE student counts, school enrolment, school capacity, utilization rates, and school-level comparison tools.
Yes. Users can explore neighbourhood density, housing growth, community development history, and address-level community indicators.
Yes. Some dashboards cover long-term trends, including community growth from 1885 to 2026, CBE student counts from 2002 to 2026, and municipal elector turnout from 1983 to 2025.