Home → Civic & Social Analytics → Community Growth Map
How Time Lights Up Calgary(1885–2026)
Best viewed on PC or iPad
Explore how Calgary grew from 1885 to 2026 through an animated community growth map. Visualize housing stock expansion, neighbourhood development, housing density, and urban growth patterns across Calgary communities over time.
Explore Related Insights


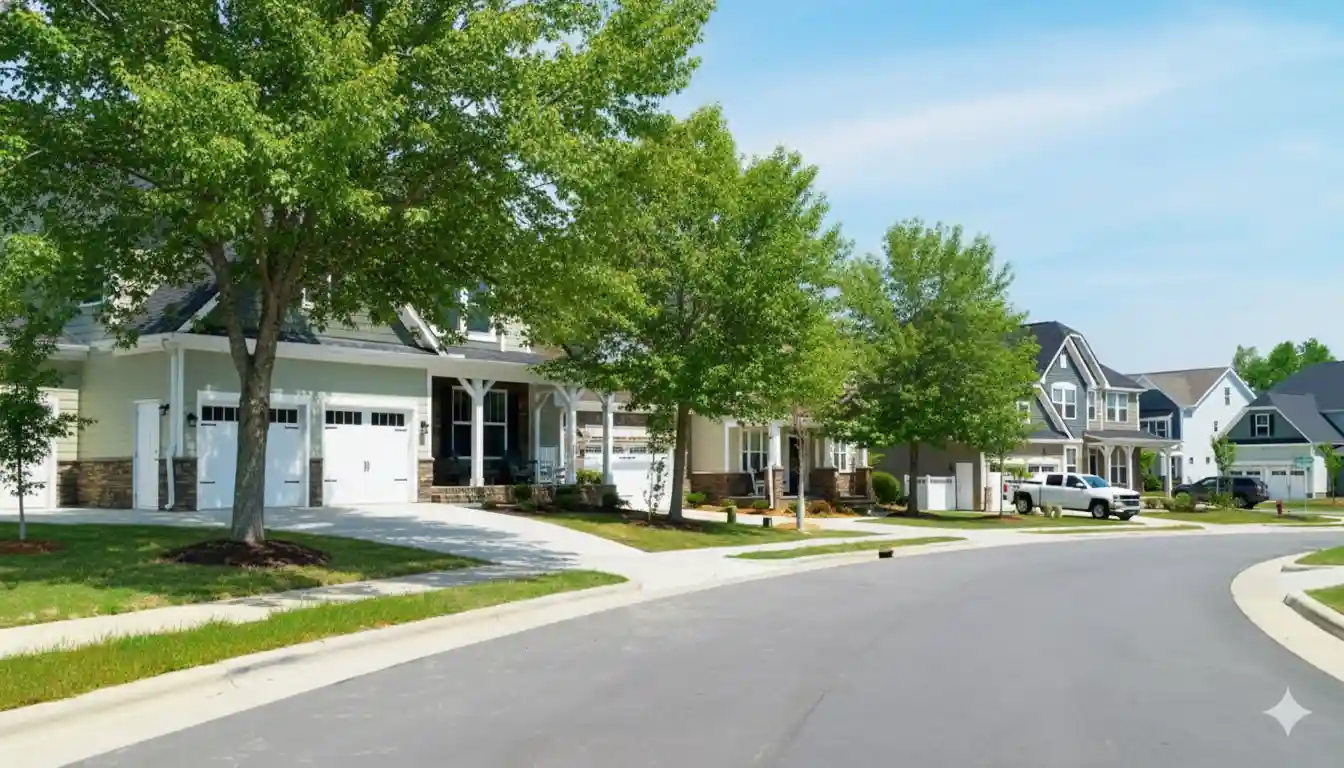
About Calgary Community Growth Map 2026
About Calgary Community Growth Map 2026
YYC-Wander's Calgary Community Growth Map visualizes how Calgary communities grew from 1885 to 2026 using housing stock data and community boundaries.
The animated timeline shows how housing development expanded across Calgary, revealing neighbourhood growth patterns, urban expansion, housing density, and long-term community development trends.
What Information Is Included?
- Calgary community growth timeline
- Housing stock growth by community
- Housing density by community
- Urban expansion patterns
- Neighbourhood development history
- Community housing growth comparison
- Historical Calgary growth visualization
- Calgary housing development from 1885 to 2026
Frequently Asked Questions
How does the Calgary Community Growth Map work?
The map animates housing stock growth across Calgary communities, showing how neighbourhoods expanded over time.
What does housing density represent?
Housing density measures the number of homes per square kilometre within each Calgary community.
What years are included?
The visualization covers Calgary community growth from 1885 through 2026.
Can I compare Calgary communities?
Yes. Hover over communities to view housing stock, land area, and housing density statistics for each year.